Inventory Turnover: What is It and How Is It Calculated?

One of the best strategies for strengthening your bottom line and boosting efficiency within your business is to take a closer look at inventory management data. As a whole, metrics like efficiency ratios can help businesses to assess their performance in using assets effectively. One such efficiency ratio is the inventory turnover ratio. This vital metric can help businesses to understand better and, if needed, shift their approach to inventory management.
Table of Contents
- What Is Inventory Turnover Ratio?
- Why Is Inventory Turnover Ratio Important?
- How to Calculate Inventory Turnover
- How to Calculate Inventory Turnover for Point-of-use Inventory
- Point-of-use Inventory Turnover Example from the Electrical Contracting Industry
- Inventory Turnover – MRO Inventory Example
- Factors That Affect Inventory Turnover Ratio
- Example of Great Inventory Turnover
- Example of Bad Inventory Turnover
- How To Improve a Bad Inventory Turnover
- The Bottom Line
- Frequently Asked Questions
What Is Inventory Turnover Ratio?
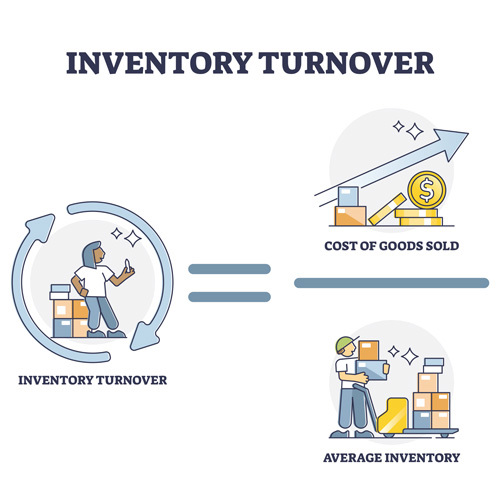
Inventory turnover ratio refers to how quickly a company’s inventory is sold and replaced within a set period, such as one year or month. This financial metric, also called stock turnover or inventory turnover rate, can show how effectively a company utilizes its assets (inventory) to generate sales.
Why Is Inventory Turnover Ratio Important?
Learning how to calculate inventory turnover ratios and apply your findings to your business operations moving forward can help you make critical decisions. This metric can help shed light on the impacts of poor inventory management that may not have been noticeable before. For example, if a company’s inventory turnover ratio is lower than the industry average, they may need to carry less inventory. In other cases, abnormally high inventory turnover ratios can signal insufficient inventory with a risk of stockouts.
Calculating the inventory turnover ratio and adjusting your inventory management practices can help you notice and address issues such as obsolete inventory and stockouts. Through this evaluation process, businesses can better optimize their inventory on hand to meet customer demand while avoiding unnecessarily high carrying costs and expiring inventory.
How to Calculate Inventory Turnover
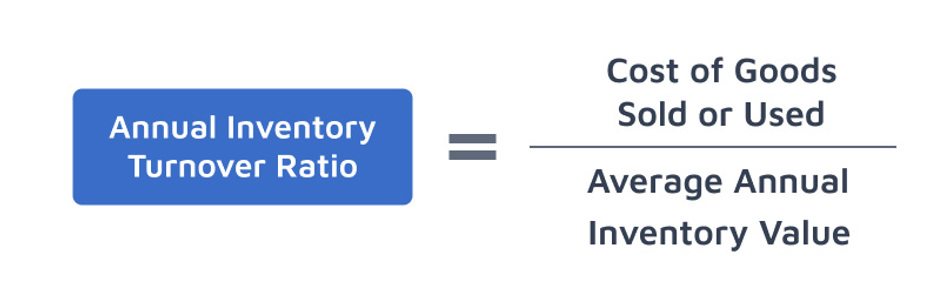
The formula for calculating the inventory turnover ratio is as follows:
Inventory Turnover = Cost of Goods Sold or used (over 12 months) ➗ Average Annual Inventory Value
Understanding each element of this inventory turnover formula is essential to come up with the correct calculation. The cost of goods sold (COGS) is also known as the cost of sales. This term refers to the amount a company paid for its inventory.
Calculating the average inventory on hand for the denominator in this formula accounts for seasonality effects. To calculate the average inventory on hand, add the value at the end of the period (such as the year) to the value at the beginning of the period and then divide by two. Alternatively, you can average the inventory value at the end of each month of the year to get the average inventory on hand.
How to Calculate Inventory Turnover for Point-of-use Inventory
Sometimes inventory isn’t sold, it’s used.
For example, electrical contractors use inventory on a job site. Calculating inventory turnover for point-of-use inventory is different in 2 respects:
- The calculation needs to account for safety stock by subtracting it from the equation.
- The numerator in the equation is Annual Inventory Usage rather than Cost of Goods Sold.
In this case, the formula for calculating POU inventory turnover is as follows:
Annual Inventory Turns = Annual Inventory Usage ➗ (Average Value of Inventory On Hand - Safety Stock)
Point-of-use Inventory Turnover Example from the Electrical Contracting Industry
Electrical contractors don’t often sell their inventory. They use it. This is a classic case of managing inventory at the point-of-use instead of the point-of-sale.
Contractors are less profitable if they have a lot of unused inventory sitting on shelves that they don’t need. The electrical contractor wants to ensure that they don’t stockout so they can always complete their job. Still, they need to maximize turnover to ensure they spend as little cash on inventory as possible since unused inventory increases a company’s carrying costs.
In this case, contractors should aim for inventory turnover in the range of 8 to 12 or a ratio of 8:1 to 12:1.
Before calculating their inventory turnover, contractors need to classify their inventory into regularly consumed inventory vs. inventory they keep for safety stock. Whatever you have in safety stock may have very poor inventory turnover. Still, you don’t want those in your calculations because you simply have to have that inventory in stock in order to prevent stockouts.
TIP: When calculating point-of-use inventory turnover, make sure you subtract safety stock from the cost of goods used for the year so it doesn’t skew your calculations.
Inventory Turnover – MRO Inventory Example
Sometimes, an airline hangar or a fulfillment center needs to keep track of MRO inventory, such as janitorial and sanitation supplies. They don't sell the inventory, but they need to track and manage this point-of-use stockroom inventory well, or they may be unable to do their primary business operation of repairing planes or shipping packages. It is costly and cumbersome to put tail spending MRO inventory, such as janitorial and sanitation supplies, into ERP or MRP business software designed to manage a company's strategic spending or A/B class parts.
So if a fulfillment center has an Average Annual Usage of $5000 of paper towels and an Average On-hand Inventory Value of $1100 and they keep $100 of safety stock, then the inventory turnover of the paper towels is 5. There is probably room to decrease the min/max settings and keep less on hand in order to increase the turnover if the fulfillment center can be sure that their Jan/San supplier can deliver the paper towels reliably and promptly when needed.
Factors That Affect Inventory Turnover Ratio
There is no predetermined, one-size-fits-all goal for inventory turnover ratio because a wide range of factors impact inventory turnover.
These factors include:
- Industry dynamics: Product perishability, seasonality, customer trends, and other industry-specific aspects all play a role in the inventory turnover ratio.
- Sales fluctuations: Many companies use inventory turnover ratio to analyze the success of their sales and marketing efforts. Lower turnover may point to a period of lower sales or a dip in customer demand.
- Inventory management: Companies without a dependable inventory management strategy are more likely to see abnormalities in their inventory turnover ratio. For example, a company may have a high inventory turnover ratio if they experience frequent stockouts because their average inventory on hand is low. This is not necessarily a positive indicator, since stockouts mean that customer demand is not being met. Similarly, a low inventory turnover ratio may mean that a company is carrying too much product, which can hurt their bottom line due to carrying costs and obsolescence.
Example of Great Inventory Turnover
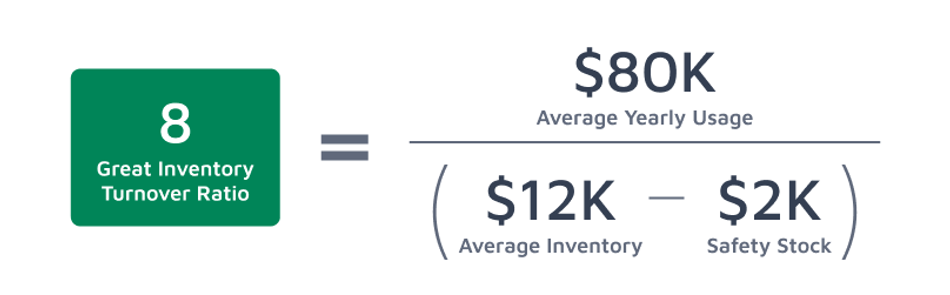
In general, anything that is turning 10 or more times a year is good inventory turnover. A company with inventory turnover of 10 can be confident that it is worth investing in and carrying that inventory for successful business operations.
So if an electrical contractor has an Average Yearly Usage of $80,000 of electrical panels and Average On-hand Inventory of $12000 and $2000 of safety stock, then they have a great inventory turnover of 8.
Great Inventory Turnover Calculation:
Inventory Turnover of 8 = Average Yearly Usage of $80k / (Average on-hand inventory of $12,000- Safety Stock of $2,000)
Example of Bad Inventory Turnover
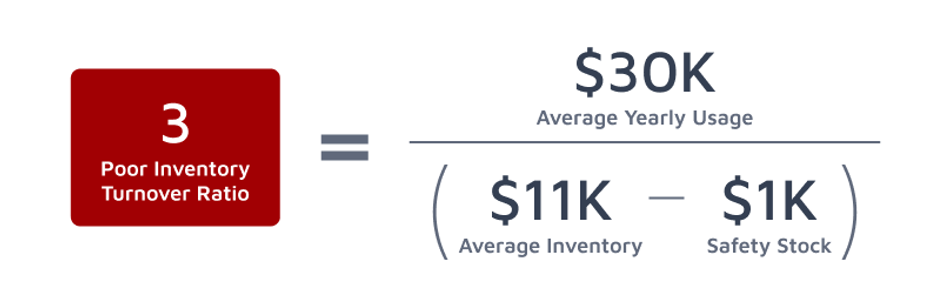
Inventory turnover is an annual calculation. In most cases, anything that turns only 2 or 3 times a year is bad inventory turnover. It is like money sitting wasted on a shelf. In this case, you need to decrease your minimum levels of that inventory so you don’t replenish it too soon, thereby allowing you to “burn it off”.
If you have $1000 of average inventory and your Average Inventory Usage/COGS for the year is $3000 and you have $100 of safety stock then your inventory turnover is 3. Having your inventory turnover 3 times a year is not great.
Bad Inventory Turnover Calculation:
Inventory Turnover of 3 = Average Inventory Usage of $30K / (Average Inventory Value of $11,000 - $1,000 of Safety Stock)
How To Improve a Bad Inventory Turnover
How can you improve turnover? If you reduce the set minimums and maximums you have for your inventory, you will burn it off by not replenishing it as often.
Inventory auto-replenishment apps that use QR code scans for cycle counts and usage tracking make it very easy to adjust minimum and maximum levels that trigger the right amount of replenishment. Replenishment apps like eTurns TrackStock can calculate what your optimized inventory levels and min/max settings should be based on your current usage, ensuring that you have the highest inventory turnover possible for your business.
The Bottom Line
The eTurns TrackStock app can help companies improve their inventory turnover ratio and lower their inventory carrying costs through helpful inventory optimization tools. For example, using TrackStock’s Min/Max Tuning feature allows businesses to carry the ideal amount of inventory based on their past usage, eliminating stockouts while also avoiding excess carrying costs. Features like these help businesses boost efficiency and save money, which will be reflected in future inventory turnover ratios.
Frequently Asked Questions
Inventory turnover is one of the most important metrics for measuring inventory performance. Here are answers to common questions about inventory turnover ratios, calculations, benchmarking, and ways to improve inventory efficiency.
It measures how often inventory is sold and replaced over a period.
Divide cost of goods sold by average inventory for the same time frame.
It shows how efficiently a business manages inventory and meets demand.
It depends on the industry, but higher ratios generally indicate better performance.
By optimizing stock levels, improving demand forecasting, and reducing excess inventory.